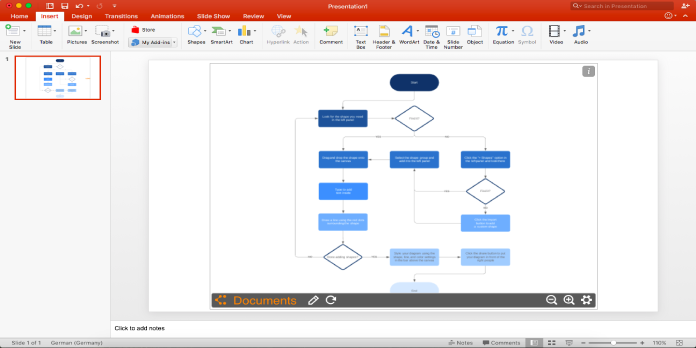
Here we can see, “How to Make a Flowchart in Powerpoint”
What Is Powerpoint?
Microsoft PowerPoint is a powerful presentation program that was created by the company Microsoft. It is bundled with Word, Excel, and other Microsoft Office productivity tools and is a standard component of its Microsoft Office suite software.
The program creates complex business presentations, simple educational outlines, and more using slides to convey multimedia-rich information.
Add a flow chart to a slide in PowerPoint in Windows
- Select SmartArt from the Insert tab.
- Select the Process category on the left side of the Choose a SmartArt Graphic dialogue box.
- Single-click a flow chart in the middle pane to see its name and explanation in the dialogue box’s right pane.
- Then click OK after selecting the flowchart you want.
- Replace the [Text] placeholders with the steps in your flow chart after adding the flow chart to your slide.
- The color and style of the SmartArt graphic can also be changed. Click the SmartArt Design tab on the ribbon while it’s selected on your slide, then Change Colors or open the SmartArt Styles gallery to see the options.
Add a flow chart to a slide in PowerPoint in macOS
- Click SmartArt and then Process on the Insert tab of the ribbon.
- Select Process from the drop-down menu of categories.
- Replace the [Text] placeholders with the steps in your flow chart after the flow chart has been added to your slide.
- You can also change the SmartArt graphic’s color or style. First, click the SmartArt Design tab on the ribbon while it’s selected on your slide, then click Change Colors or open the SmartArt Styles gallery to see the options.
Add a flow chart to a slide in PowerPoint in Web
- Select SmartArt from the Insert tab of the ribbon, then Process.
- Point to Process in the drop-down menu that appears, and then select a layout.
- Replace the [Text] placeholders with the steps in your flow chart after the flow chart has been added to your slide.
You can also change the SmartArt graphic’s color or style. First, click the SmartArt Design tab on the ribbon while it’s selected on your slide, then click Change Colors or open the SmartArt Styles gallery to see the options.
Conclusion
I hope you found this information helpful. Please fill out the form below if you have any questions or comments.
User Questions:
- Do you have the ability to convert Visio to PowerPoint?
By creating slide snippets of your Visio diagrams and then exporting them to PowerPoint for Microsoft 365, you can share them with others. Getting your diagrams into PowerPoint has never been easier.
- In PowerPoint, how do you make a Swimlane?
Select a new blank presentation in PowerPoint. Next, add a large rectangle to your slide by going to the Insert tab and clicking Shapes (this will act as the body of your swimlane). To use it as the title section of your swimlane, add another text box on top or to the left of the rectangle.
- How come to Visio isn’t included in Office 365?
Although Visio is part of the Microsoft Office suite, it is not included in the 365 subscription packages. Therefore, you must pay an additional fee to use it regularly, but Visio can be included in your free trial to see if it is useful.
- Use PowerPoint to create and animate a flow chart.
Design and animate a flow chart in PowerPoint from powerpoint
- How to create flowcharts, animated diagrams, and charts in Microsoft Powe…
How to create flowcharts, animated diagrams and charts in Microsoft Powe… from powerpoint


